Python Fundamentals (Part 3.)
- CL

- Mar 1, 2020
- 2 min read
Updated: Apr 8, 2020
02/07~ 02/17 note-taking
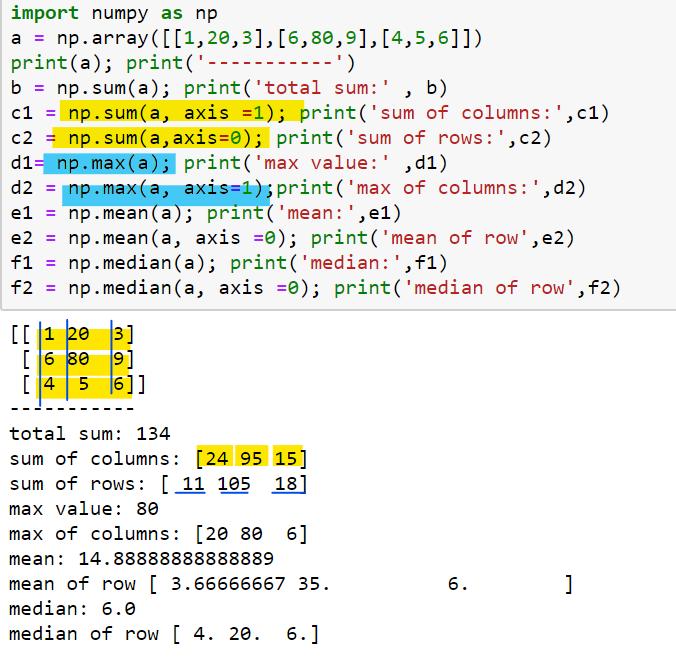
np.array(); np.max(); np.sum(); np.mean()
Inside the parameter, you can put axis = 0 or axis =1
axis = 0 row
axis = 1 column
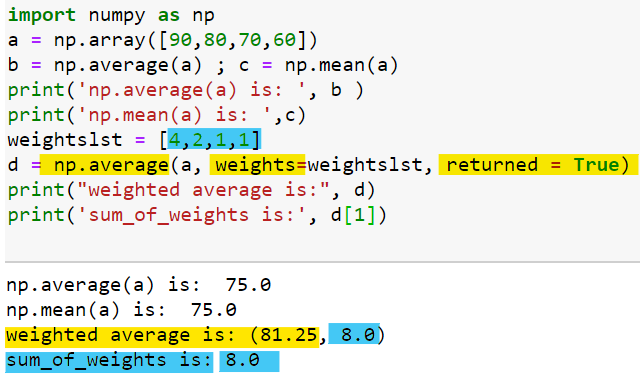
np.average()
parameters:
weights : array_like, optional.
returned : bool, optional. Default is `False`. If `True`, the tuple (`average`, `sum_of_weights`) is returned
For example, the sum of weights below is: 4 + 2 + 1 + 1 = 8. The weighted average is calculated as (90 X 4 + 80 X 2 + 70 X 1 + 60 X 1) / 8 = 650 /8 = 81.25
Let's draw some charts!!
import matplotlib.pyplot
% matplotlib inline: graph output is displayed inline directly below the code cell that produced it!
Common commands:
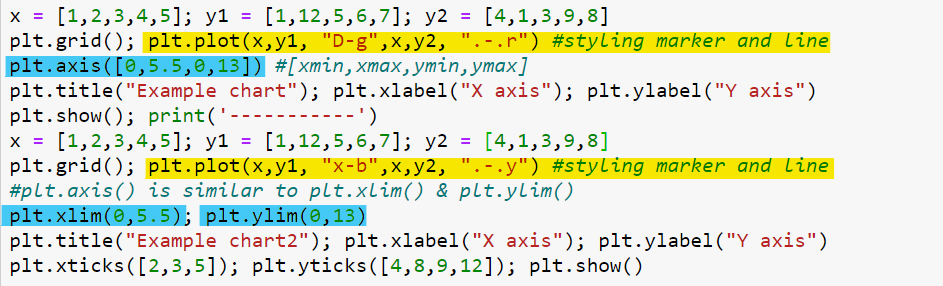
plt.plot(data)
plt.axis([xmin, xmax, ymin, ymax])
plt.title()
plt.xlabel()
plt.ylabel()
plt.show()
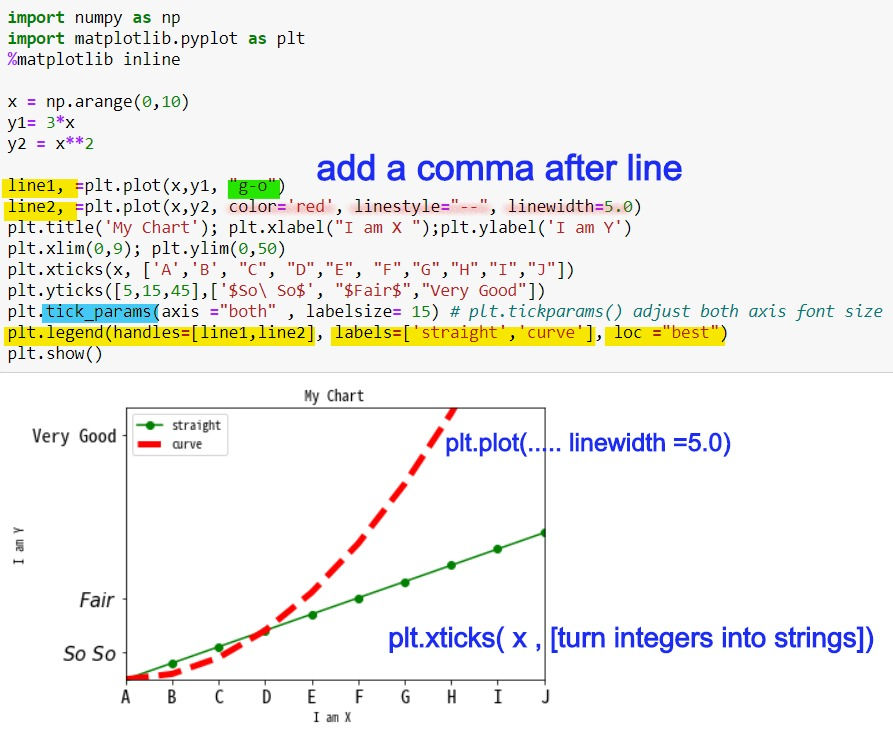
How to style markers and lines?
' [marker][line][color]'
character description ====== ================== ``'.'`` point marker ``','`` pixel marker ``'o'`` circle marker ``'v'`` triangle_down marker ``'^'`` triangle_up marker ``'<'`` triangle_left marker ``'>'`` triangle_right marker ``'1'`` tri_down marker ``'2'`` tri_up marker ``'3'`` tri_left marker ``'4'`` tri_right marker ``'s'`` square marker ``'p'`` pentagon marker ``'*'`` star marker ``'h'`` hexagon1 marker ``'H'`` hexagon2 marker ``'+'`` plus marker ``'x'`` x marker ``'D'`` diamond marker ``'d'`` thin_diamond marker ``'|'`` vline marker ``'_'`` hline marker =========================== Line Styles character description ====== ================== ``'-'`` solid line style ``'--'`` dashed line style ``'-.'`` dash-dot line style ``':'`` dotted line style ===========================
Colors character color ====== ========== ``'b'`` blue ``'g'`` green ``'r'`` red ``'c'`` cyan ``'m'`` magenta ``'y'`` yellow ``'k'`` black ``'w'`` white ============================
Let's see some examples!

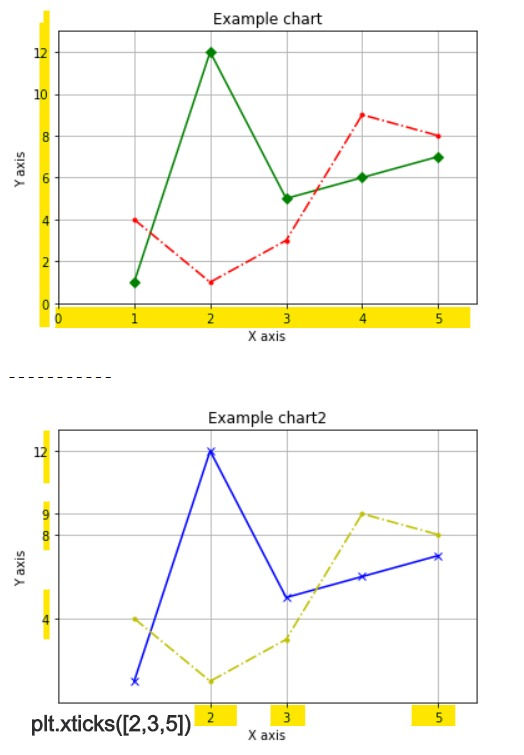
----------------------------------------------------------------------
plt.legend(handles = [ ], labels = [ ] , loc = 'best')
loc means the location of legend
The string ``'best'`` places the legend at the location, among the nine locations defined so far, with the minimum overlap with other drawn artists. This option can be quite slow for plots with large amounts of data; your plotting speed may benefit from providing a specific location.
The strings ``'upper left', 'upper right', 'lower left', 'lower right'`` place the legend at the corresponding corner of the axes/figure.
The strings ``'upper center', 'lower center', 'center left', 'center right'`` place the legend at the center of the corresponding edge of the axes/figure.
The string ``'center'`` places the legend at the center of the axes/figure.
---------------------------------------------------
2020-02-10
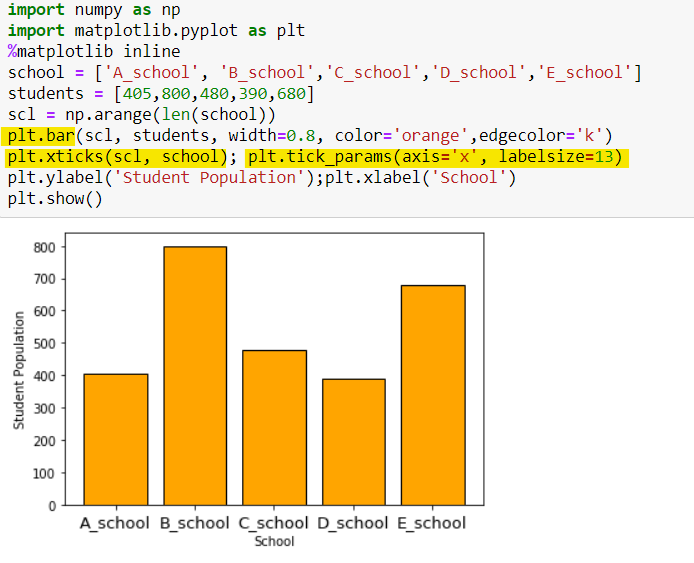
How to draw a vertical bar , horizontal bar?
Vertical Bar
Horizontal Bar

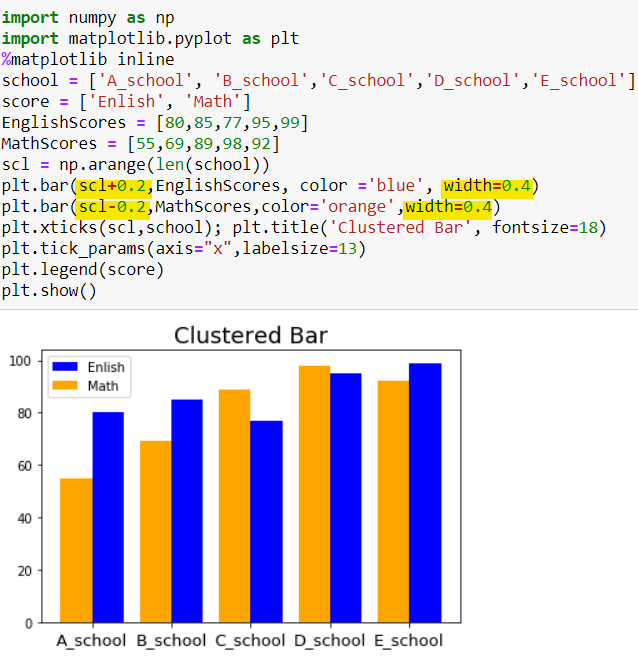
How to draw stacked bar and clustered bar ?
Stacked Bar

Clustered Bar
----------------------------------------------------------------------------
Scatter Plot & Histogram & Pie Chart & Boxplot
Scatter Plot
plt.scatter(x,y,color=[ ] , size = [ ])

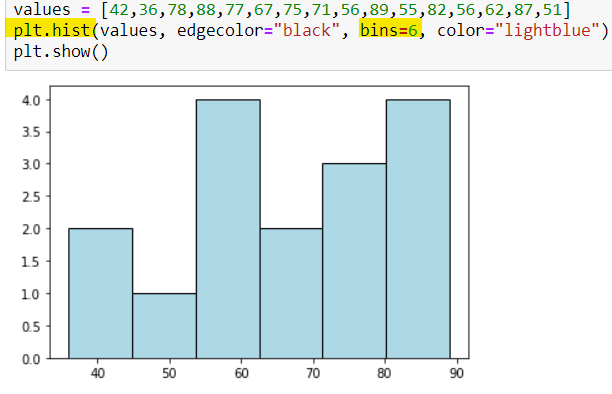
Histogram
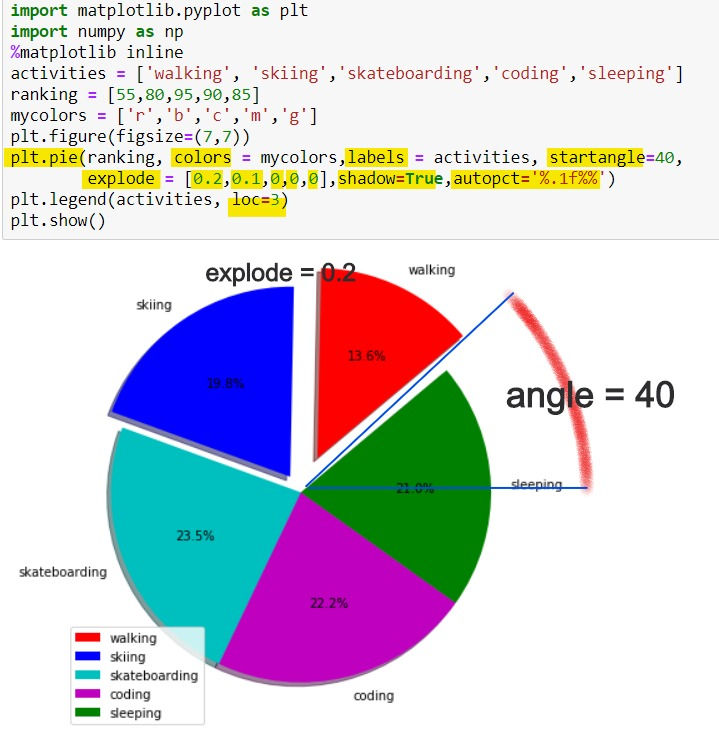
Pie Chart
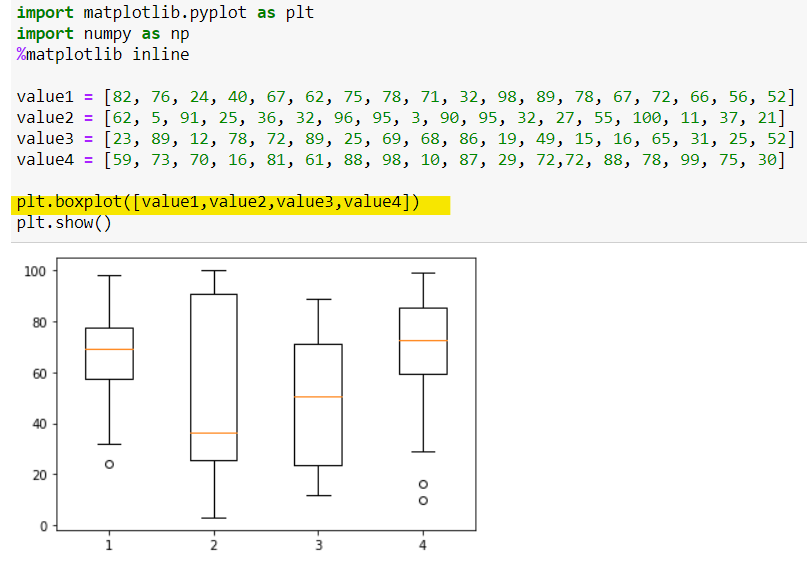
BoxPlot
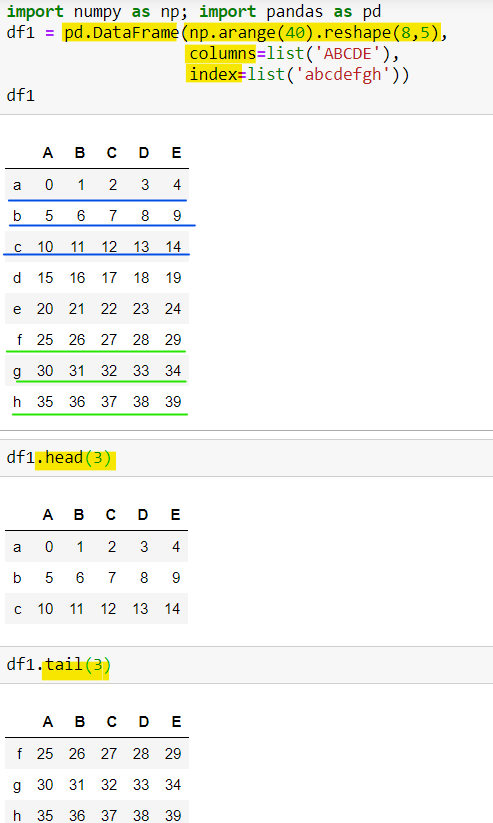
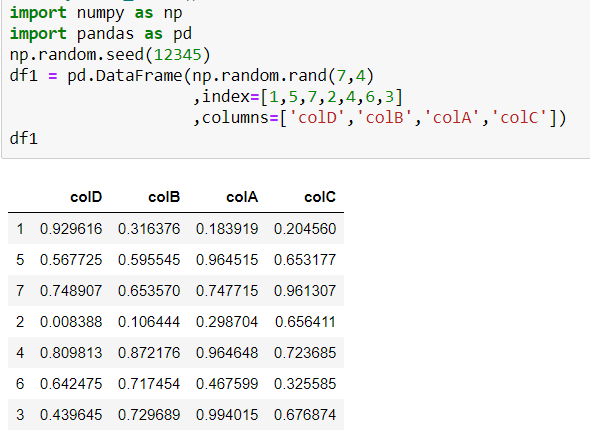
DataFrame & Pandas


////////////////////////////////////////////
Retrieve data by column:
df [[ "Column_name", "Column_name" ]]
//////////////////////////
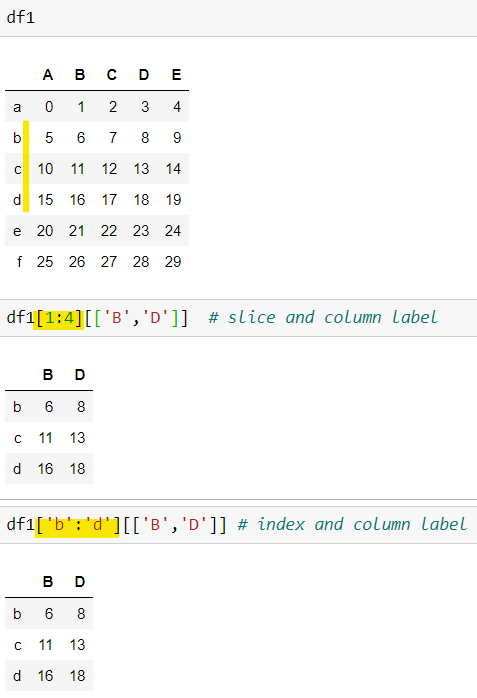
Retrieve data by rows
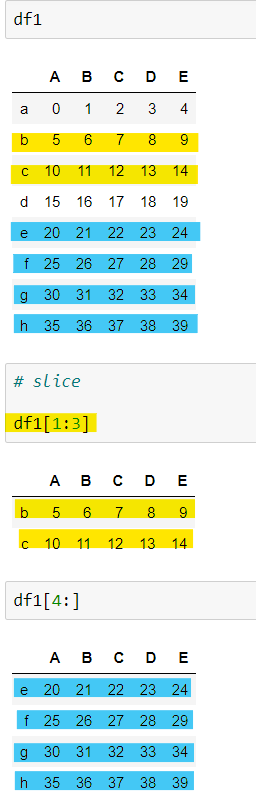
Retrieve Data from certain rows and columns:
Date Range
pd.date_range('20200226', periods = 5)
default is day, so it will return 5 days from 2020-02-26

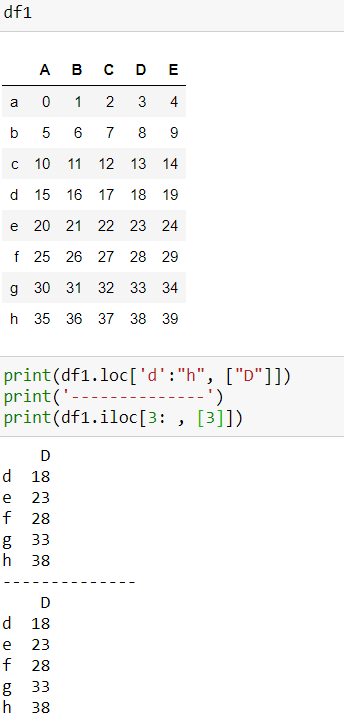
loc & iloc
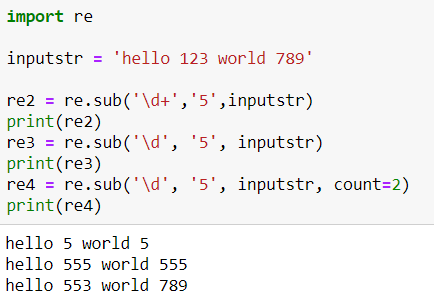
Regular Expression!
import re
re.findall( )
re.sub()
//////////////////////////
np.vsplit , np.hsplit , np.split()

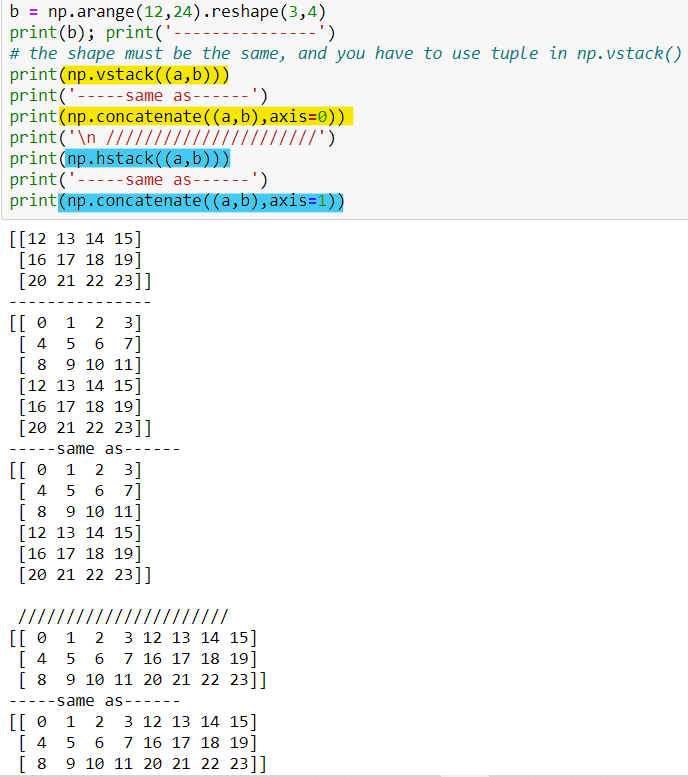
np.vstack, np.hstack, np.concatenate()
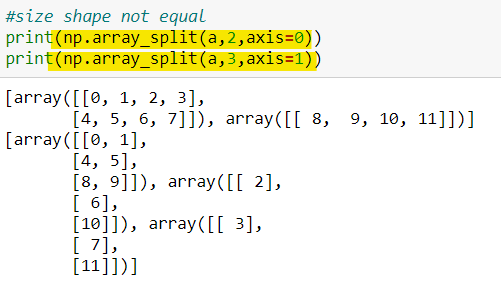
np.array_split() when size is not the same
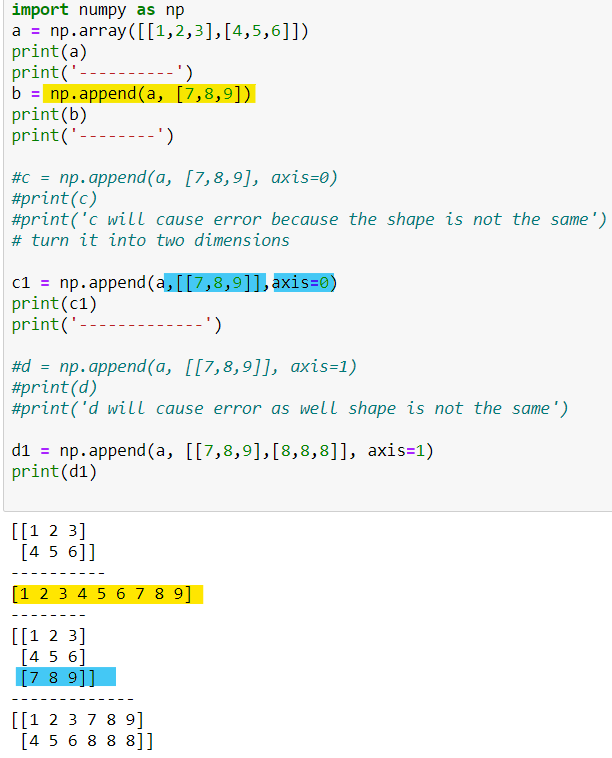
np.append()
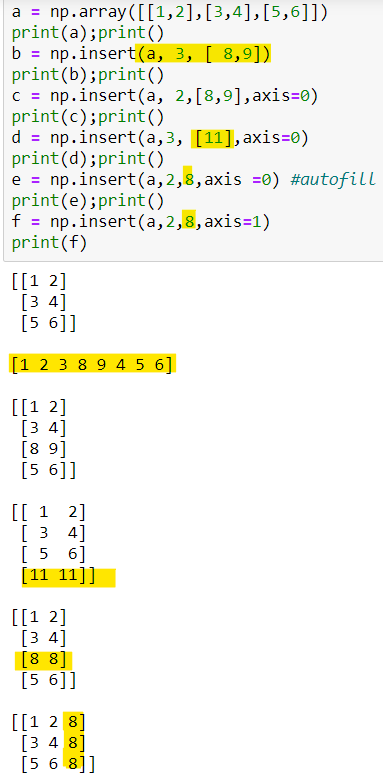
np.insert ()
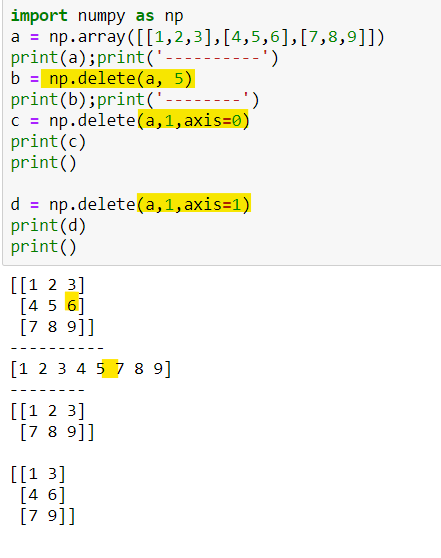
np.delete()
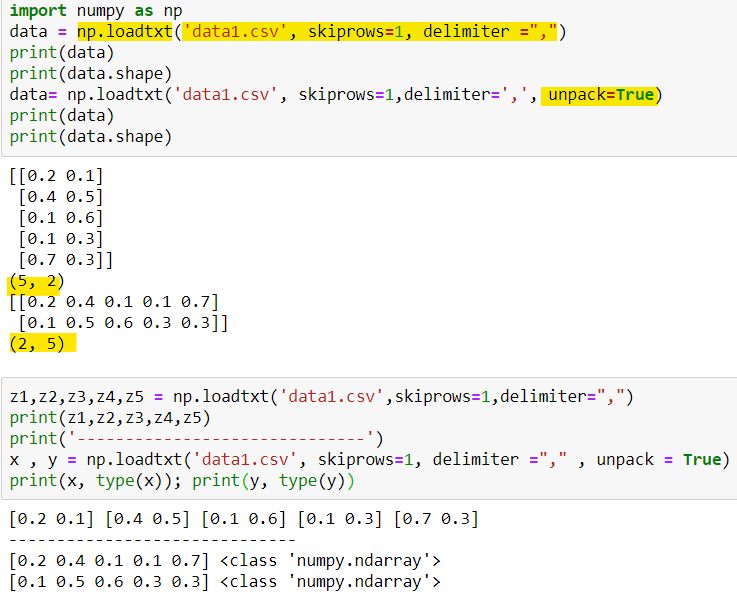
np.loadtxt
np.genfromtxt

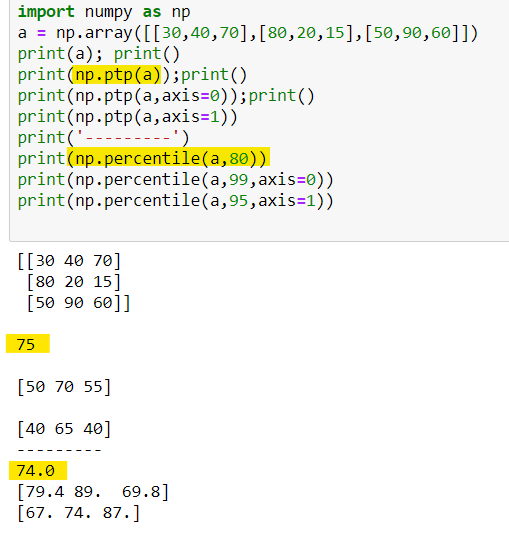
np.ptp (range of values) ; np.percentile
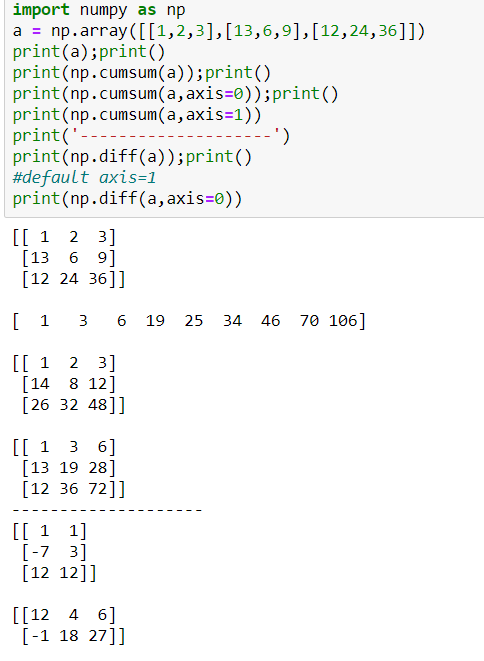
np.cumsum
np.diff
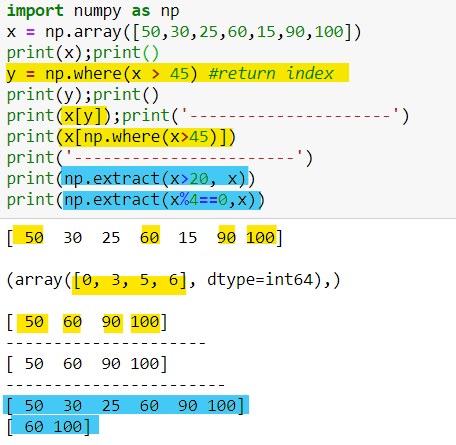
np.where ; np.extract
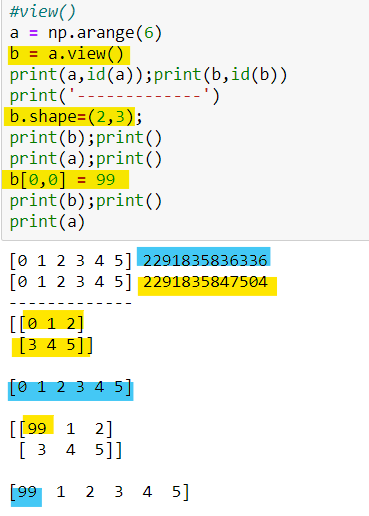
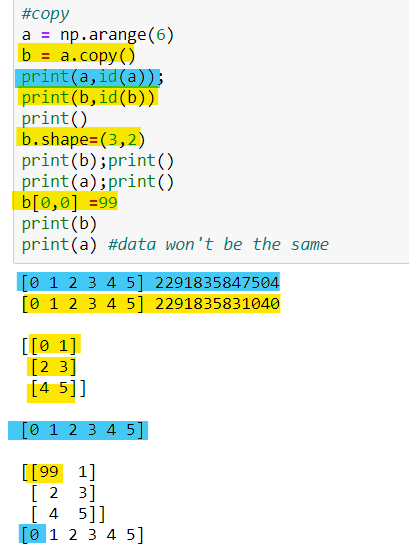
making copies of an array
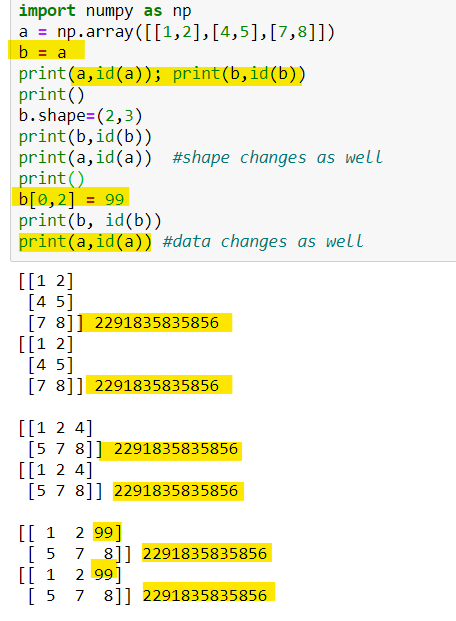
view(); copy()
///////////////////////////////////
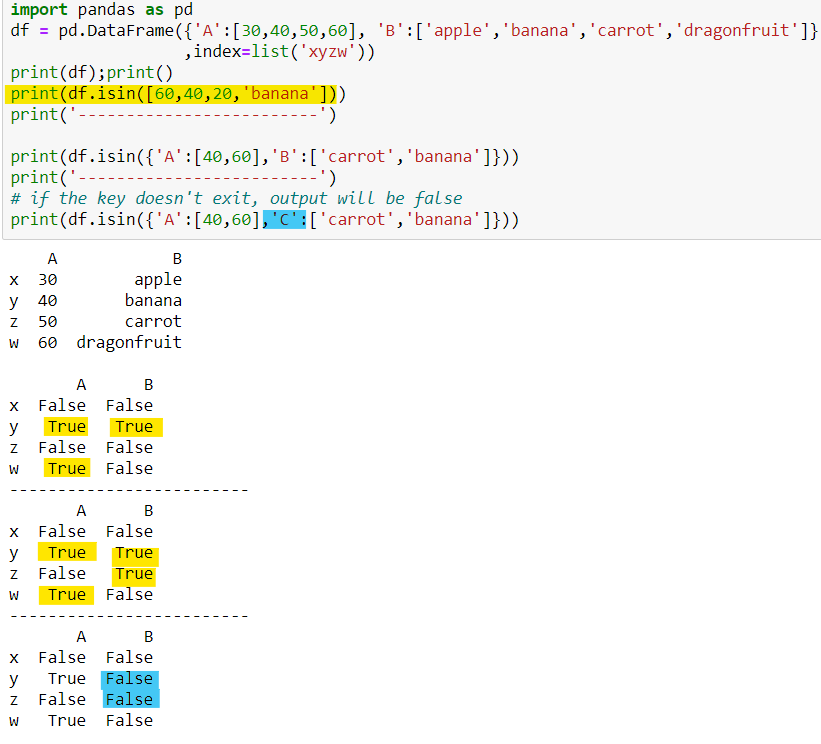
df.isin()
df.sort_index()

pd.date_range(); pd.bdate_range()
notes: bdate_range() return weekdays only


Comments